PAPER 3
1.The daily supply and demand curves for beef in a city are given by
Qs = −20 + 20P
Qd = 80 − 5P
Where Qs and Qd are the quantities in thousands of kilos and P is the price per kilo
in US$.
(a) Calculate Qs and Qd at a price of US$3 per kilo. [2 marks]
Qs = −20 + 20(3)
= -20 + 60 = 40 000 kilos
Qd = 80 − 5(3)
= 80 -15 = 65 000 kilos
(b) Label the axes on the graph below. [1 mark]
Y- Price of beef in US $
X- Quantity of beef in thousands of kilos
(c) Construct the supply and demand curves on the above graph and identify the Q
intercept for the demand curve and the P intercept for the supply curve. [3 marks]
Qs = −20 + 20P Qd = 80 − 5P
0 = −20 + 20P Qd = 80 − 5(0)
0 = −20 + 20(1) Qd = 80
intercept at (0, 1) (80, 0)
(d) Calculate the equilibrium price and quantity below and identify both of these on
the graph. [4 marks]
−20 + 20P = 80 − 5P Qs = −20 + 20 (4)
25P = 100 Qs = −20 + 80
P = $4 Q = 60 000 kilos
A health scare about the safety of beef leads to a decrease in demand of 25000 kilos at
any price.
(e) State the equation for this new demand curve. [1 mark]
Qd = 80 − 5P
Qd = (80-25) − 5P
Qd = 55 − 5P
(f) Draw the new demand curve on the graph and identify the new Q intercept. [2 marks]
(g) Explain, with reference to the figures, why the price that you calculated in part
(d) is no longer the equilibrium price. [4 marks]
At the old quantity supplied equilibrium price of US$4, with a new demand
curve, there would now be excess of 25 000 kilos. This means that now, at a
price of US$4, quantity demanded will be 35 000 kilos and quantity supplied
will still be 60 000 kilos. The price will have to fall in order to eliminate the
excess quantity supplied and to reach a new equilibrium and market efficiency.
(h) Calculate the new equilibrium price and quantity below and identify both of
these on the graph. [4 marks]
55 − 5P = −20 + 20 75 = 25P 3$ = P
Qs= −20 + 20 (3) Qs= −20 + 60 Q = 40 000 kilos
(i) If the health scare causes a decrease in demand of 25 000 kilos, explain why
the new equilibrium quantity is not 25000 kilos lower than the original
equilibrium quantity. [4 marks]
At the original price of US$4, with the new demand curve, there will be excess
quantity supplied as stated in part g. There will be a movement down the existing supply curve
towards the new equilibrium, but also a shift to the left at each price level by 25 (thousand) of the demand curve in order to eliminate the excess quantity
supplied.
Thus, quantity supplied will fall by 20 000 kilos as price falls, but quantity
demanded will increase by 5000 kilos because of the falling price. So, in the
end, the equilibrium quantity has only fallen by 20 000 kilos, from 60 000 kilos
to 40 000 kilos.
Question 2
The table below shows the income tax rates that apply to different ranges of earnings
for workers in an economy.
Income (US$) Income tax rate (%)
0 – 6000 0
6001 – 20000 20
20001 – 50 000 40
50 001+ 50
• Individual A (low income) earns US$18000 per year and spends US$14000
on goods and services, of which 15% is indirect tax.
• Individual B (middle income) earns US$42000 per year and spends US$28000
on goods and services, of which 15% is indirect tax.
• Individual C (high income) earns US$100000 per year and spends US$45000
on goods and services, of which 15% is indirect tax.
(a) Distinguish between direct and indirect taxes. [2 marks]
Direct taxes are set on income and indirect taxes are set on expenditure
(b) Calculate the amount of income tax paid by individuals A, B and C as a
percentage of their income. [6 marks]
Individual A: ( 0x 6000) + ( 0.2 x 12 000) = 2400 $ (2400/18000) x 100 =13.3%
Individual B: ( 0x 6000) + ( 0.2 x 14000) + (0.4 x 22000) = 11600$ (11600/42000) x 100 =27.62%
Individual C: ( 0x 6000) + ( 0.2 x 14000) + (0.4 x 30000) + (0.5 x 50000) = 39 800$ (39 800/100 000) x 100 =39.8%
(c) With reference to the concepts of average and marginal rates of tax,
use the data from the table to explain whether this type of income tax is
progressive or regressive. [4 marks]
The average rate of a progressive income tax paid increases as the individual's income increases while regressive is vice versa. In this case as shown by the numbers and figures in table and part b, the marginal rate of tax is higher than the average, meaning this tax is progressive.
(d) Calculate the amount of indirect tax paid by individuals A, B and C as a
percentage of their income. [3 marks]
Individual A: ((14 000 x 0.15)/ 18 000) x 100 = 11.67%
Individual B: ((28 000 x 0.15)/ 42 000) x 100 = 10 %
Individual C: ((45 000 x 0.15)/ 100 000) x 100 = 6.75%
(e) Calculate the average rate of total tax (direct + indirect) paid by individuals
A, B and C on their individual incomes. [6 marks]
Individual A: 13.3% + 11.67% = 25%
Individual B: 27.62% + 10% = 37.62%
Individual C: 39.8% + 6.76% = 46.55%
(f) Explain why governments often have tax systems in which the average rate of
tax rises as income rises. [4 marks]
Governments often use progressive income tax to tackle the problem of inequitable distribution of income. They use higher income tax rates on people who earn more income to redistribute the money from the richer citizens to the poorer and therefore be closer to equal distribution and possibilities for everyone.
Sunday, 6 March 2016

Sunday, 28 February 2016
IB question structuring
3. (a) Explain what might happen to the level of inflation if a government decides to move from a budget surplus to a budget deficit. [10 marks]
Inflation happens when there's a sustained increase in the average price levels. As in macroeconomics one of governments' main objective is low and steady rate of inflation, they are often ones trying to manipulate it. Government can target inflation through spending, as government spending is part of Aggregate demand which determines inflation. AD= C+G+I+(X-M)
As government moves from budget surplus; meaning they receive more tax revenue than they spend in a year. To a budget deficit; a government spending more than it earned as a tax revenue over a year. It likely means they have increased the governmental spending in the economy, which means an increase in AD and is therefore likely to increase the rate of inflation.
Another way a government could go from a budget surplus to budget deficit, yet still cause a rise in the rate of inflation is by decreasing taxes. A decrease in taxes would mean less government revenue yet it would encourage more spending in the population, therefore increasing AD.
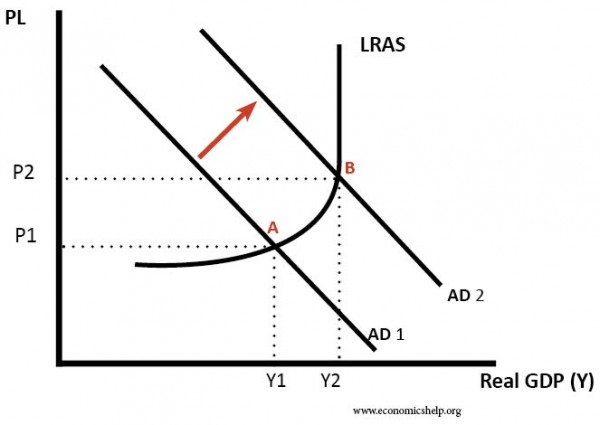
Through these expansionary fiscal policy methods, governments would increase AD, causing the AD curve to shift to the right. Resulting in a new equilibrium B, at which the average price levels have increased from P1 to P2 and the Real GDP has increased from Y1 to Y2. This would only happen if we were to assume cetris paribus for the other determinants of AD and that there has been no outwards shift in the LRAS. As there is no increase in supply in the long run, it could possibly be a demand-pull inflation as the economy isn't able to meet the demand and would be forced to increase prices. Therefore if through government spending or decrease in income tax as an example of expansionary fiscal policy, the AD shifts outwards resulting in higher average prices there has been an increase in the rate of inflation.
In real world this might not always end up in the best way as high inflation might cause more inflation as people will be looking for cheaper goods to buy and the countries own goods would not be competitive enough on the world market, therefore increasing imports and decreasing exports. This could lead to trade deficit, in return causing a further decrease in the governments budget. This situation is known as the twin deficit hypothesis. This is a situation United States has been battling for many many years already.
(b) To what extent is an increase in interest rates the most effective cure for inflation? [15 marks]
As mentioned above, inflation is often combated through governments activities such as fiscal, but also by central banks activities. Interest rates, the cost of a loan expressed as a percentage, is part of monetary policy. Monetary policy includes the Central Bank managing interest and exchange rates to control the quantity of currency in the economy.
As the central bank rises interest rates, it will lower borrowing and encourage saving instead as consumers are likely to benefit more from saving due to higher interest rates. Less borrowing and more saving means less spending in the economy, eventually meaning less consumption. As mentioned above C is a part of AD, therefore a decrease in C would mean a decrease in AD. Vice versa to the explaining in part a, when AD lowers, the APL and real GDP are likely to fall.
 As there is a shift to the left from AD1 to AD2, the APL drops from P1 to P2, but there is also a drop for real GDP from Y1 to Y2. From this graph we can also see how using interest rates would only work in the short run. In the long run the suppliers would adjust back to the more efficient level.
Yet using interest rates too vigorously and for too long to combat inflation rates may hinder economic growth. As shown in the graph the real GDP values drop together with inflation as there is less consumption. Less consumption is essentially less demand in an economy, so in the long run businesses will want to opt for the new level of demand and will decrease their production. Decreasing production in return means letting workers go, therefore increasing the level of unemployment in the economy. high levels of unemployment in return means even less consumption, furthering the drop in inflation. Eventually the drop could get too big and start to harm the economy instead. For businesses, higher interest rates also mean less investment therefore hindering businesses from evolving in terms of size and efficiency.
Additionally, higher interest rates may encourage foreign portfolio investments, therefore causing an appreciation in the currency. Higher exchange rate in return makes it harder to export and better to import, resulting in trade deficit; high imports might eventually worsen the inflation again.
Therefore we can conclude that interest rates are a good and efficient way to effectively combat high inflation quickly and for a short amount of time. Yet even then it depends whether inflation is a result of an appreciated currency or high AD. Yet if there's a need to control inflation in the long term, the most effective ways include supply side policies such as subsidies and tax breaks for producers to increase the long run supply to meet the rising demand and therefore combat rising price levels and still maintain economic growth.
Monday, 11 January 2016
Economic predictions for 2016
Estonia's real estate market
In the fourth quarter of 2015, a total of 15,110 transactions worth about 747 million euros were made. A year ago in the fourth quarter, a total of 13,830 real estate transactions were made, worth 628 million euros.
Real estate price index growth in the third quarter of 2015 compared to the third quarter of 2014 was 14.5% and 2.5% compared to the last quarter. The apartment price index grew by 9.3%, undeveloped land price index of 27.4%, and the built-up residential price index of 18.5%.
Yet the real estate prices have already been climbing rapidly for the past couple of years, especially in the capital of Estonia. Tallinn and the surrounding county, considered the "first Estonia" compared to the rest of the country "2nd Estonia" has seen even more aggressive rise in prices, therefore pushing up there rates for the whole country. As most young people come to study and live in Tallinn for the first years of their adult lives, this situation is making it hard for young people, especially for young families to buy themselves a home. At this point it is very hard to find an apartment/house in Tallinn that costs under a 100,000€ and is in a condition where you could move in today. Yet these apartments, especially the new ones being built are more and more often bought by foreigners, consequently showing the market that there are enough people to buy the apartments for the current prices, allowing brokers to ask for even higher prices in the near future.
As the average salary in Estonia is greatly lower than the average in the rest of the Europe, it is becoming more and more difficult for locals to buy real estate. More loans are being taken, yet younger people are often not able to get a loan either. Therefore I predict that in the third or 4th quarter of the year 2016, the real estate market of Estonia is about the crash. Prices are going to drop and once again the market will hit a recession, leaving unfinished buildings standing by the sides of the roads.
In the fourth quarter of 2015, a total of 15,110 transactions worth about 747 million euros were made. A year ago in the fourth quarter, a total of 13,830 real estate transactions were made, worth 628 million euros.
Real estate price index growth in the third quarter of 2015 compared to the third quarter of 2014 was 14.5% and 2.5% compared to the last quarter. The apartment price index grew by 9.3%, undeveloped land price index of 27.4%, and the built-up residential price index of 18.5%.
Yet the real estate prices have already been climbing rapidly for the past couple of years, especially in the capital of Estonia. Tallinn and the surrounding county, considered the "first Estonia" compared to the rest of the country "2nd Estonia" has seen even more aggressive rise in prices, therefore pushing up there rates for the whole country. As most young people come to study and live in Tallinn for the first years of their adult lives, this situation is making it hard for young people, especially for young families to buy themselves a home. At this point it is very hard to find an apartment/house in Tallinn that costs under a 100,000€ and is in a condition where you could move in today. Yet these apartments, especially the new ones being built are more and more often bought by foreigners, consequently showing the market that there are enough people to buy the apartments for the current prices, allowing brokers to ask for even higher prices in the near future.
As the average salary in Estonia is greatly lower than the average in the rest of the Europe, it is becoming more and more difficult for locals to buy real estate. More loans are being taken, yet younger people are often not able to get a loan either. Therefore I predict that in the third or 4th quarter of the year 2016, the real estate market of Estonia is about the crash. Prices are going to drop and once again the market will hit a recession, leaving unfinished buildings standing by the sides of the roads.
Sunday, 6 December 2015
Measuring Development
Part 1 and 2 – Development Data:
High HDI ranking: Canada -according to the 2014 report
Canada:
High HDI ranking: Canada -according to the 2014 report
- HDI ranking and value: HDI ranking: 8 , HDI value 0.902 (2013)
- Age structure: relatively okay number of people over the age of 65 (5.3 mil.) and much lower count of under age 5 (2.0 mil.) out of the whole population- 35.2 mil.
- Population growth rate: annual growth rate 1%
- School life expectancy: 15.9 years
- Life expectancy at birth: 81.5 years (2013)
- Total fertility rate: 1.7 children per woman
- Education expenditures: 5.5 % of GDP
- GDP per capita: 40,588 (PPP $, 2012)
- GDP – composition by sector:
- 22.0 (%GDP, Gross fixed capital formation),
- 20.9 (%GDP, General government final consumption expenditure),
- 53.3 (%GDP, Taxes on income, profit and capital gain)
- 1.8 (%GDP, Research and development expenditure),
- 1.5 (%GDP, Share of agriculture, hunting, forestry and fisheries)
- Unemployment rate: 0.9 % of the labour force
- Public debt: 177.6 b (% of GDP) (Domestic credit provided by the banking sector)
- Stock of direct foreign investment – at home: Foreign direct investment, net inflows 2.5% GDP
- Labour force participation 15y and older: 61.6% female, 71.2% male
Canada:
total dependency ratio: 47.3%
youth dependency ratio: 23.5%
elderly dependency ratio: 23.8%

youth dependency ratio: 23.5%
elderly dependency ratio: 23.8%
Low HDI ranking: Mali 2014 HDI report
- HDI ranking and value: HDI ranking: 176 , HDI value 0.407 (2013)
- Age structure: almost no population over the age of 65 (0.4 mil.), 3.0 mil. under age 5. out of the total population of 15.3 mil.
- Population growth rate: annual growth rate 3.0%
- School life expectancy: 8.6 years
- Life expectancy at birth: 55.0 years (2013)
- Total fertility rate: 6.9 children per woman
- Education expenditures: 4.7 % of GDP
- GDP per capita: 1,607 (PPP $,2012)
- GDP – composition by sector:
- 22.2 (%GDP, Gross fixed capital formation),
- 17.1 (%GDP, General government final consumption expenditure),
- 21.8 (%GDP, Taxes on income, profit and capital gain)
- 0.2 (%GDP, Research and development expenditure),
- 42.3 (%GDP, Share of agriculture, hunting, forestry and fisheries)
- Unemployment rate: ~8.2%
- Public debt:
- 19.9 (% of GDP) (Domestic credit provided by the banking sector)
- 29.1 % of GNI, External debt stock
- 0.67 % of GNI total debt service
- Stock of direct foreign investment – at home: Foreign direct investment, net inflows 1.7% GDP
- Labour force participation 15y and older: 50.6% females, and 81.4% males
Dependency ratio: Mali
total dependency ratio: 100.2%
youth dependency ratio: 95.1%
elderly dependency ratio: 5%
total dependency ratio: 100.2%
youth dependency ratio: 95.1%
elderly dependency ratio: 5%
PART 3- the Lorenz curve
As seen on the graph the income share of the both populations of Canada and Mali are very equal and follow the general trend of a Lorenz curve.
Note: Data for Mali is from 2010, but for Canada the data is from year 2000.
Note: Data for Mali is from 2010, but for Canada the data is from year 2000.
PART 4
1.What conclusions can you draw about the correlation between GDP, HDI, income equality, social and
economic indicators between developed and developing countries?
A higher value in one does not mean a higher value in all other indicators.
2. Does a high HDI correlate with relative income equality? What about low HDI?
There is a slight correlation with high HDI, countries ranked higher in HDI tend to have lower income inequality, yet there are some exceptions such as USA. -
For countries ranked lower on the HDI there is a lesser of a correlation and more variance. Generally countries classified as medium, low or very low in the HDI have higher income inequality, yet the range of inequality is way more broad and the values for some countries quite equal the ones for countries ranked high or very high by the HDI
3. Is a high GDP indicative of high levels of human development?
No, not necessarily. Some countries ranked in the first 20 by the HDI have the same or even lower GDP count than the countries ranked last 20 by the HDI.
4. What other conclusions can you draw about economic development, national income, and equality? Economic development generally means higher national income, yet not higher equality for gender or income.
5. To what extent did your country with low HD exhibit the following characteristics?
-Low standards of living? low standards of living are present in Mali due to low incomes and high dependence on exports. As well as much of it's food supply depends on weather conditions. low access to sanitation, slightly better situation with drinking water yet still not good.
-Low incomes? very low incomes
-Inequality? As compared with other developing and developed countries, Mali has a relatively low income inequality, 33.3% GINI, (as of 2009) and constantly dropping
-Poor health? poor levels of health are present by the life expectancy as well as high child mortality rate and low birth-weight.
-Inadequate education? almost half the years of expected years in education as in countries ranked higher in HDI
-Low levels of productivity? Yes
-High rates of population growth and dependency burdens? very high dependency rate especially high youth dependency growth, as a woman will on average have 6-7 children in her life time, yet most people don't live up to 65 years.
-High levels of unemployment? relatively quite high levels of unemployment
-Dependence on agricultural production and primary product exports? mainly depends on exports of Pearls, precious stones, metals, coins, and agricultural products. ~70% of it's exports.
-Imperfect markets? Suggested to be present for a while but oligopolies are being fought against.
-Dependency on foreign developed countries for trade, access to technology, foreign investment
and aid? Receives great amounts of foreign aid from multilateral organizations such as World Bank and bilateral programs funded by the European Union, France, United States, Canada, Netherlands, and Germany.
6. How can you explain the concepts of single and composite indicators? To what extent are these indicators
effective?
"A composite indicator measures multi-dimensional concepts (e.g. competitiveness, e-trade or environmental quality) which cannot be captured by a single indicator. Ideally, a composite indicator should be based on a theoretical framework / definition, which allows individual indicators / variables to be selected, combined and weighted in a manner which reflects the dimensions or structure of the phenomena being measured."
A single indicator measures only one aspect such as a health indicator measuring life expectancy at birth rate.
These indicators both single and composite indicators give the most effective and significant descriptions/summaries of a situation in a country when results are compiled together. when measured individually, such as the different single indicators then countries can be ranked very differently. Some countries ranked very high by the HDI have some single indicators on the level of the countries ranked very low by the HDI
These indicators both single and composite indicators give the most effective and significant descriptions/summaries of a situation in a country when results are compiled together. when measured individually, such as the different single indicators then countries can be ranked very differently. Some countries ranked very high by the HDI have some single indicators on the level of the countries ranked very low by the HDI
Wednesday, 2 December 2015
Myths about economic development, debunked
● What are the weaknesses and strengths of the Human Development Index (HDI) as an indicator of
progress in comparison to GDP/GNP per capita? (Total 5 marks)
the strengths of the HDI include:
● Explain two reasons why increased investment in education is essential for development in developing economies. (Total 4 marks)
Developing economies are often determined to be that due to low quality of the labour force, meaning the main or only output of the economy are primary commodities. therefore having a labour force with higher education helps for the economy to expand and develop different production opportunities.
As well as higher education means further expansion or developing of healthcare and education systems through the new labour that is available for the vacancies.
● What evidence would indicate to an economist that a country is experiencing economic development as well as economic growth? (10 marks)
improvement in quality of life, better education, average life span, lower unemployment, increasing GDP, better money supply, decrease in prices for medicine.
● Evaluate the strategies (based on your findings in gapminder) that may be used to achieve economic development. Refer to real world examples in your answer. (15 marks)
I found a great answer to this, but I don't think it would be too useful to write it out, so I'll just leave this ling here: https://mudit92.wordpress.com/2010/02/11/rwanda-strategies-to-achieve-economic-growthdevelopment
the strengths of the HDI include:
- taking in account many other indicators and factors for progress not only the GDP/GNI per capita
- Shows the quality of life, such as education, life expectancy and access to sanitation
- Helps to determine whether the country is considered developed or developing
- Income, knowledge and GDP are confounding variables and are inter-related.
- while using HDI it is hard to determine which factors influenced others
- Doesn't show the variation of data within a country, such as inequality
● Explain two reasons why increased investment in education is essential for development in developing economies. (Total 4 marks)
Developing economies are often determined to be that due to low quality of the labour force, meaning the main or only output of the economy are primary commodities. therefore having a labour force with higher education helps for the economy to expand and develop different production opportunities.
As well as higher education means further expansion or developing of healthcare and education systems through the new labour that is available for the vacancies.
● What evidence would indicate to an economist that a country is experiencing economic development as well as economic growth? (10 marks)
improvement in quality of life, better education, average life span, lower unemployment, increasing GDP, better money supply, decrease in prices for medicine.
● Evaluate the strategies (based on your findings in gapminder) that may be used to achieve economic development. Refer to real world examples in your answer. (15 marks)
I found a great answer to this, but I don't think it would be too useful to write it out, so I'll just leave this ling here: https://mudit92.wordpress.com/2010/02/11/rwanda-strategies-to-achieve-economic-growthdevelopment
Workpoint 28.3 and review questions
Big Mac index
http://bigmacindex.org/
The cheapest in Ukraine and most expensive in Switzerland
End of chapter review questions on page 342
1. using a PPF diagram, explain how it is possible for a country to achieve economic growth
-
2. To what extent is it fair to say that economic growth inevitably leads to economic development?
http://bigmacindex.org/
The cheapest in Ukraine and most expensive in Switzerland
End of chapter review questions on page 342
1. using a PPF diagram, explain how it is possible for a country to achieve economic growth
-
2. To what extent is it fair to say that economic growth inevitably leads to economic development?
economic growth is known to lead to higher production and sales count, and therefore also higher profits and salary for workers. This all can lead to further rise in government revenue through taxes, which could then be used to develop a better education and healthcare system which lead to economic development through raising living standards.
Yet in developing countries, increase in production will often create negative externalities such as destroying wildlife and lowering the air and freshwater quality- which will greatly decrease the living standards.
3. To what extent could it be argued that all developing countries share the same set of characteristics?
to an extent concerning the problems the country is experiencing about its economic situation. Yet the extent of these problems differ for all developing countries therefore they should be all considered as separate cases.
The main reasons developing countries differ in characteristics come due to it's geographical location which also determines the availability of natural resources and possibilities for production; the country's history and current ethnic and religious background as well as the politic situation in the country.
Examples of two developing countries are Maldives and Angola. One is an island country, the other is a country in Africa, therefore their geographical properties differ greatly and therefore also differing their possibilities in production. Maldives is mainly relying on tourism and services, while Angola is dependent on exporting primary commodities.
Yet in developing countries, increase in production will often create negative externalities such as destroying wildlife and lowering the air and freshwater quality- which will greatly decrease the living standards.
3. To what extent could it be argued that all developing countries share the same set of characteristics?
to an extent concerning the problems the country is experiencing about its economic situation. Yet the extent of these problems differ for all developing countries therefore they should be all considered as separate cases.
The main reasons developing countries differ in characteristics come due to it's geographical location which also determines the availability of natural resources and possibilities for production; the country's history and current ethnic and religious background as well as the politic situation in the country.
Examples of two developing countries are Maldives and Angola. One is an island country, the other is a country in Africa, therefore their geographical properties differ greatly and therefore also differing their possibilities in production. Maldives is mainly relying on tourism and services, while Angola is dependent on exporting primary commodities.
Wednesday, 18 November 2015
Australia's Terms of Trade
1. Data of ToT over the 10 year period of 2001-2010
2. Identify the year to year trends in the terms of trade.
The trade of balance in this data is represented as a percentage of GDP, and is generally fluctuating on the negative side meaning there is a trade deficit; more expenditure on imports than earned from exports.
4. Next, using your understanding of price elasticity of demand, research the types of exports and imports for your assigned country.
IMPORTS: Australia is a major importer of machinery and transport equipment, computers and office machines and telecommunication lasers. Therefore tertiary goods
EXPORTS: Rich in natural resources, Australia is a major exporter of commodities. Metals like iron-ore and gold account for 28 percent of total exports, coal for 18 percent and oil and gas for 9 percent. Manufactured goods constitute 33 percent of the total exports with food and metal products and machinery and equipment accounting for the biggest share. Agricultural products, particularly wheat and wool make up 5 percent of trade outflows. Mainly primary and secondary goods.
a. Based on the results of your research, to what degree do you think demand for exports/imports is elastic or inelastic?
Most of Australia's exports are demand inelastic as they are primary and secondary goods. Yet many if not most of the goods imported by Australia are elastic in demand as they require higher technology and labour skill for production and are priced higher, therefore are known to be price elastic in relation to demand.
b. Based on your research, does it appear that changes to the terms of trade has affected the balance of payments?
In this specific example I don't see a clear correlation between the Terms of Trade and balance of payments, as the fluctuation in the trade balance has very little correlation with the values of ToT
2001 104.8%
2002 105.85%
2003 105.92%
2004 116.18%
2005 131.08%
2006 145.52%
2007 152.39%
2008 174.63%
2009 162.98%
2010 178.9
2. Identify the year to year trends in the terms of trade.
From the year 2000 to 2010 there is a pretty consistent and even to say a rapid yearly increase in terms of trade, growing from a 100% in year 2000 to 178.9% in 2010.
Even though the data shown a pretty clear increasing trend, from year 2008 to 2009 there was a drop in ToT from 174.63% to 162.98% respectively. Yet for the next year ToT picked up again and increased from the 2009 162.98% to 178.9% in 2010, being the highest and latest value in the data, proving the clear increasing trend.
3. Identify the changes in trade balance over this same period.
changes in trade balance were quite unrelated to those of ToT, and show more of a fluctuation. A decrease from 2001 til 2005, dropping from 0.18% to -2.72%, from there on it picked up again and increase to -1.61% in 20017. and since then has been fluctuating heavily yearly.
3. Identify the changes in trade balance over this same period.
changes in trade balance were quite unrelated to those of ToT, and show more of a fluctuation. A decrease from 2001 til 2005, dropping from 0.18% to -2.72%, from there on it picked up again and increase to -1.61% in 20017. and since then has been fluctuating heavily yearly.
Balance of trade as a % of GDP
2001 0.18%
2001 0.18%
2002 0%
2003 -2.12%
2004 -2.7%
2005 -2.72%
2006 -1.81%
2007 -1.61%
2008 -2.6%
2009 0.1%
2010 -0,97%
The trade of balance in this data is represented as a percentage of GDP, and is generally fluctuating on the negative side meaning there is a trade deficit; more expenditure on imports than earned from exports.
In years 2001, 2002, and 2009 there were slight positive values, at 0.18%, 0% and 0.1% respectively. The trade balance values were the lowest in 2004, 2005 and 2008 at
4. Next, using your understanding of price elasticity of demand, research the types of exports and imports for your assigned country.
IMPORTS: Australia is a major importer of machinery and transport equipment, computers and office machines and telecommunication lasers. Therefore tertiary goods
EXPORTS: Rich in natural resources, Australia is a major exporter of commodities. Metals like iron-ore and gold account for 28 percent of total exports, coal for 18 percent and oil and gas for 9 percent. Manufactured goods constitute 33 percent of the total exports with food and metal products and machinery and equipment accounting for the biggest share. Agricultural products, particularly wheat and wool make up 5 percent of trade outflows. Mainly primary and secondary goods.
a. Based on the results of your research, to what degree do you think demand for exports/imports is elastic or inelastic?
Most of Australia's exports are demand inelastic as they are primary and secondary goods. Yet many if not most of the goods imported by Australia are elastic in demand as they require higher technology and labour skill for production and are priced higher, therefore are known to be price elastic in relation to demand.
b. Based on your research, does it appear that changes to the terms of trade has affected the balance of payments?
In this specific example I don't see a clear correlation between the Terms of Trade and balance of payments, as the fluctuation in the trade balance has very little correlation with the values of ToT
Wednesday, 4 November 2015
Review questions -economic integration
1. Using a diagram, explain the difference between a free trade area and a customs union. Use real world examples

A free trade area is just a trading bloc that involves several countries trading in between themselves with no boundaries in place.
Yet, a customs union involves a free trade area as it is one step higher in the economic integration. instead of just not having any trading boundaries between the bloc countries, They have also agreed on common external trading barriers put in place for countries outside of the customs union.
An example of a free trade bloc is NAFTA, consisting of Mexico, Canada and United States of America.
Example of a customs union is CARICOM, consisting of Antigua, Barbuda, Bahamas, Barbados, Belize, Dominica, Grenada, Guyana, Haiti, Jamaica, Montserrat, Saint Kitts and Nevis, Saint Lucia, Saint Vincent, the Grenadines, Suriname, Trinidad and Tobago.
2. Discuss the likely effects of a membership of a customs union. Use a real world example.
From stepping into a customs union a member is likely to experience either trade creation or trade diversion. As well as membership can also increase the market size as well bring more diversity and development of products such as technology. Yet if country A has higher production costs of certain goods than other countries in the bloc, country A might experience higher unemployment than before due to production shifting from their country to the others and vice versa.
Trade creation- a reduction in tariff barriers leading to an increase in consumer surplus and economic welfare. As well as production going from a higher cost producer to a lower cost producer therefore leading to a regain of world efficiency.

A free trade area is just a trading bloc that involves several countries trading in between themselves with no boundaries in place.
Yet, a customs union involves a free trade area as it is one step higher in the economic integration. instead of just not having any trading boundaries between the bloc countries, They have also agreed on common external trading barriers put in place for countries outside of the customs union.
An example of a free trade bloc is NAFTA, consisting of Mexico, Canada and United States of America.
Example of a customs union is CARICOM, consisting of Antigua, Barbuda, Bahamas, Barbados, Belize, Dominica, Grenada, Guyana, Haiti, Jamaica, Montserrat, Saint Kitts and Nevis, Saint Lucia, Saint Vincent, the Grenadines, Suriname, Trinidad and Tobago.
2. Discuss the likely effects of a membership of a customs union. Use a real world example.
From stepping into a customs union a member is likely to experience either trade creation or trade diversion. As well as membership can also increase the market size as well bring more diversity and development of products such as technology. Yet if country A has higher production costs of certain goods than other countries in the bloc, country A might experience higher unemployment than before due to production shifting from their country to the others and vice versa.
Trade creation- a reduction in tariff barriers leading to an increase in consumer surplus and economic welfare. As well as production going from a higher cost producer to a lower cost producer therefore leading to a regain of world efficiency.
Trade diversion-international economics in which trade is diverted from a more efficient exporter towards a less efficient one, causing welfare loss as well as loss of world efficiency.
Example: UK joined EU, they had a comparative advantage in the production of lawn mowers, resulting in trade creation in the EU when trading barriers are removed. Before the French were making lawnmowers on a higher cost. Now consumers benefit from lower costs of lawnmowers from England as well as there is regain of world efficiency.
3. Evaluate the consequences of membership of a monetary union. Use a real world example.
The consequences include:
the reduction in transactions cost of changing currency;
the reduction of exchange risk leading to greater trade and foreign investment, and to a lower risk premium embodied in the cost of raising capital;
increased transparency in price comparison;
political gains of closer union and cooperation brought about the greater closeness of economic relationships; - preparation for complete economic and monetary integration as well as keeping relations smooth
Example: European Union
3. Evaluate the consequences of membership of a monetary union. Use a real world example.
The consequences include:
the reduction in transactions cost of changing currency;
the reduction of exchange risk leading to greater trade and foreign investment, and to a lower risk premium embodied in the cost of raising capital;
increased transparency in price comparison;
political gains of closer union and cooperation brought about the greater closeness of economic relationships; - preparation for complete economic and monetary integration as well as keeping relations smooth
Example: European Union
Thursday, 22 October 2015
Trading blocs and Economic Integration
A trading bloc: a group of countries that join together in some form of agreement in order to
increase trade between themselves and/or to gain economic benefits from cooperation on some level.
Below is a list of some of several regional trading blocs.
East African Community (EAC)
- The nations involved in the trading bloc
- Republic of Kenya
- Republic of Rwanda
- Republic of Tanzania
- Republic of Burundi
- Uganda of Uganda
- Identify the kind of trading bloc (customs union, free trade area, common market, monetary union)
- EAC is a customs union- a type of trade bloc which is composed of a free trade area between the member countries, that have agreed to a common external tariff with respect to imports from the rest of the world.
- The impact that membership in the trading bloc has had on the economy of one member nation.
- Rwanda’s Minister for East African Affairs, Amb. Valentine Rugwabiza, has said the country is already reaping benefits of being part of the East African Community, seven years since becoming a member. During the past few years since Rwanda joined the EAC, the investments coming from the region have consistently increased. Businesses from Kenya have invested in Rwanda more than US$450 million which has contributed to the creation of thousands of jobs. Yet they have not made such impressive progress regarding trading across borders, and this doesn't depend solely on them; it has to do with how long it takes to cross those borders, cost of transport and of course non tariff barriers. Even though tariffs between the countries have been removed as they are in a customs union, different non-tariff restrictions keep popping up.
- An example of trade creation and trade diversion (appropriate charts)Kenya exports approximately three-fifths of its goods to Uganda and Tanzania, but had been facing tariffs of between 10 and 20 per cent before the establishment of the East African Community. In September 2014 Tanzania became the largest export destination of Kenyan goods within East Africa. The long-held perception by Uganda and Tanzania that Kenya's economy - mainly the manufacturing sector - was more competitive than theirs - causing production to go from higher to lower cost - more efficient. GRAPH COMING AND DIVERSION EXAMPLE TOO
Wednesday, 21 October 2015
Foreign Exchange Market and Exchange Rate Determination
1. Exchange rates are like prices, in that they are determined by supply and demand. But not all exchange rates are allowed to float freely, since the governments or central banks of some countries actively intervene in the market for their currency to manipulate its value. Identify one policy a government or central bank could use to strengthen the value of its currency and one policy that could weaken the value of a currency.
2. What are the benefits of having a stronger currency?
Having a currency that has a higher value than another currency means you can buy they currency cheaper. Therefore also meaning that the other country's export goods are cheaper for you to buy.
3. What are the benefits of having a weaker currency?
When having a weaker currency in comparison to a stronger one, the people in the country with the stronger currency will will want to buy more of your exports as they would be cheaper for them to buy.
- Governments could use fiscal policy to lower the taxes in a country, leaving people with more money in their pockets to spend. Therefore spending on imports would rise as well, causing an increase in supply- leading to a decrease in the value of the currency
- To strengthen the value of a currency, governments could use monetary policy in order to increase interest rates. This increases foreign investors wanting to invest into your country, leading to more demand- which leads to strengthening of the currency.
2. What are the benefits of having a stronger currency?
Having a currency that has a higher value than another currency means you can buy they currency cheaper. Therefore also meaning that the other country's export goods are cheaper for you to buy.
3. What are the benefits of having a weaker currency?
When having a weaker currency in comparison to a stronger one, the people in the country with the stronger currency will will want to buy more of your exports as they would be cheaper for them to buy.
4. Which determinant of exchange rates presented in the video do you think are most attributable to the fluctuating values of currencies on foreign exchange markets, and why? Relative incomes, relative interest rates, relative inflation rates, speculation or simply the tastes and preferences of global consumers?
I think the determinant of exchange rates most attributable to the fluctuating values of currencies on foreign exchange markets is relative interest rates. As a country's interest rates rise, more people/companies from foreign countries will want to invest into your country- in order to earn more money back. And as interest rates are constantly managed, and in today's internet based world, investments are quick to make causing constant differences in the flow of money from one countries to other. As well as these investment amount are often very big and therefore affecting the exchange rate greatly.
I think the determinant of exchange rates most attributable to the fluctuating values of currencies on foreign exchange markets is relative interest rates. As a country's interest rates rise, more people/companies from foreign countries will want to invest into your country- in order to earn more money back. And as interest rates are constantly managed, and in today's internet based world, investments are quick to make causing constant differences in the flow of money from one countries to other. As well as these investment amount are often very big and therefore affecting the exchange rate greatly.
EURO (€) VS. NORWEGIAN KRONER (NOK)
List and explain the factors that might lead to a fall in the supply of the selected currency in relation to the Euro market.
Norway might be experiencing high rates of inflation, therefore their products would seem more expensive for European countries resulting in less demand for Norwegian products leading to a decrease in the supply of euros in Norway,
Norway might have lowered their interest rates, therefore foreign European countries will lack an interest to invest in Norway, leading to a decrease in supply of euros.
Another explanation could be a decrease in income for some European countries, therefore decreasing demand for foreign goods such as goods from Norway.


Tuesday, 20 October 2015
Worksheet 23.1- Exchange Rates
Exchange rates, currency manipulations and the balance of trade
- How does China continuing to undervalue its currency threaten the industrial economies of its largest trading partners?
- As china is artificially keeping i's currency at a low level compared to the dollar of United States, one of its largest trading partner. It is making sure US companies rather want to have their goods manufactured in china as the labour there is cheaper due to the low value of China's currency. Yet US's large companies don't develop factories in the US itself, the problem of high unemployment might suffer even more. Less manufacture and high unemployment will eventually lead to a decrease in market size and economic development.
- What is China’s purpose for maintaining the low value of the RMB relative to the currencies of other nations?
- As china has a large population it also has a large quantity of labour, a lot of it unskilled labour. Therefore they have a lot of people to work to produce manufactured goods for a low wage. As China maintains it's currency at a low value, it will be cheaper for foreign countries to buy China's exports making them more appealing. Through selling more of their goods, China experiences economic growth in relation to the market size and money in the circulation.
- What would be a unilateral protectionist measure the US government may advocate if the WTO
refuses to take action against China’s currency manipulations? How would you advise president
Obama on the issue of whether to take protectionist action against China in the context of the
current economic crisis in America?
- A unilateral protectionist measure the US government could take against China, would be to impose a quota or a tariff on the imports from China. This could cause an aggression in the population of United States as many of their goods would suddenly become more expensive, yet the build-up of domestic factories providing available vacancies would take a bit of time. Yet eventually this wood lead US out of the economic crisis and maybe even move to growth.
Placing quotas on foreign goods has helped US before, like when they places quotas on... steel. With the quotas in place they could develop their domestic manufacture of steel, which eventually lead to US steel productions being one of the cheapest and most efficient in the world. I'd advise for US to set quotas on certain goods, yet only when being sure there would be someone ready to develop domestic production of the exact same or supplementary good.
Saturday, 17 October 2015
Non-price Determinants-Supply & Demand
The non-price determinants of supply include:
- Changes in costs of factors of production (land, labour, capital, entrepreneurship). As there is an increase in costs of production → the supply shifts to the left, meaning there would be less supply, or in other words you would have to pay more for the same quantity.
- State of technology, as technology Improves- supply shifts to the right (meaning more supply for cheaper prices)
- Price of related goods: An increase in the price of a related good can influence the supply of the original good. Consider the tradeoff in the production of corn and wheat. If the price of corn rises relative to the price of wheat, it would probably be profitable to move resources from wheat production to corn production. This will cause the supply curve of corn to shift to the right and the supply curve of wheat to shift to the left.
- Future expectations: if demand for the product is likely to rise, companies increase their supply (in order to be ready to supply more in the future and gain higher profit for example prior Christmas there would be an increased production of decorations.)
- Government intervention:
- Indirect taxes → increase costs → supply shifts left (less supply, increase in price)
- Subsidies → reduce costs → supply shifts right (more supply, cheaper price)
- other ways to intervene -exchange and interest rates.
- Size of the market: more firms producing the same or a very similar good means more supply overall, therefore supply of the market shifts to the right as more are being supplied at each price level.
- Weather/seasonality: Affecting mostly agriculture, long periods of rain or drought can influence the quantities of crop received at the end. As well as during winter seasons many countries aren't able to grow their own crops/vegetables-decreasing supply.
- Supply Shock: An unexpected event(political or environmental) that changes the supply of a product or commodity, resulting in a sudden change in its price and it's effect is almost always negative
A shift in supply could be caused by:
supply shock:A sudden political or environmental situation may change the supply of currency.government intervention: in different situations governments could impose a different exchange rate causing a shift in the market of a currency.
future expectation: if there's a serious depreciation expected in a currency in relation to another, the country/government might take measures to prevent that from happening.
The non-price determinants of demand include:
- Income: As income rises, demand for normal goods rises causing the demand curve to shift to the right. Yet the demand for inferior goods usually falls, demand curve shifts to the left.
- Consumer expectations of future: When consumers expect the prices of a certain good to drop in the future, the demand at the moment will fall and rise when the prices drop, and vice versa.
- Consumer Tastes & Preferences: If consumer change their tastes in favor (for example an advertising campaign) then demand curve shifts to the right.
- Price of related goods (substitutes and complements):
- As price of substitutes increases (movement along the curve) the demand shifts to the right.
- As price of complements increases (movement along the curve) the demand shifts to the left.
- Demographic changes: if population grows, the demand for most products will increase, thus the demand curves shift to the right as more will be demanded at each price level.
- Weather/seasons: as a country is entering a rainy season, the demand for umbrellas would increase greatly.
A shift in demand could be caused by:
weather/seasonality: many countries which depend largely on tourism see great demand in their currency over the seasons.price of related goods(other currencies): If certain countries are for example experiencing high inflation then their currency would appreciate and there would be less demand for it as it would become more expensive to obtain (as well as their exports)
consumer expectations for the future: If consumers expect the value of a certain currency to depreciate, then the demand for it at the moment might drop as consumers would be waiting for the depreciation before exchanging their money.
Subscribe to:
Posts (Atom)