PAPER 3
1.The daily supply and demand curves for beef in a city are given by
Qs = −20 + 20P
Qd = 80 − 5P
Where Qs and Qd are the quantities in thousands of kilos and P is the price per kilo
in US$.
(a) Calculate Qs and Qd at a price of US$3 per kilo. [2 marks]
Qs = −20 + 20(3)
= -20 + 60 = 40 000 kilos
Qd = 80 − 5(3)
= 80 -15 = 65 000 kilos
(b) Label the axes on the graph below. [1 mark]
Y- Price of beef in US $
X- Quantity of beef in thousands of kilos
(c) Construct the supply and demand curves on the above graph and identify the Q
intercept for the demand curve and the P intercept for the supply curve. [3 marks]
Qs = −20 + 20P Qd = 80 − 5P
0 = −20 + 20P Qd = 80 − 5(0)
0 = −20 + 20(1) Qd = 80
intercept at (0, 1) (80, 0)
(d) Calculate the equilibrium price and quantity below and identify both of these on
the graph. [4 marks]
−20 + 20P = 80 − 5P Qs = −20 + 20 (4)
25P = 100 Qs = −20 + 80
P = $4 Q = 60 000 kilos
A health scare about the safety of beef leads to a decrease in demand of 25000 kilos at
any price.
(e) State the equation for this new demand curve. [1 mark]
Qd = 80 − 5P
Qd = (80-25) − 5P
Qd = 55 − 5P
(f) Draw the new demand curve on the graph and identify the new Q intercept. [2 marks]
(g) Explain, with reference to the figures, why the price that you calculated in part
(d) is no longer the equilibrium price. [4 marks]
At the old quantity supplied equilibrium price of US$4, with a new demand
curve, there would now be excess of 25 000 kilos. This means that now, at a
price of US$4, quantity demanded will be 35 000 kilos and quantity supplied
will still be 60 000 kilos. The price will have to fall in order to eliminate the
excess quantity supplied and to reach a new equilibrium and market efficiency.
(h) Calculate the new equilibrium price and quantity below and identify both of
these on the graph. [4 marks]
55 − 5P = −20 + 20 75 = 25P 3$ = P
Qs= −20 + 20 (3) Qs= −20 + 60 Q = 40 000 kilos
(i) If the health scare causes a decrease in demand of 25 000 kilos, explain why
the new equilibrium quantity is not 25000 kilos lower than the original
equilibrium quantity. [4 marks]
At the original price of US$4, with the new demand curve, there will be excess
quantity supplied as stated in part g. There will be a movement down the existing supply curve
towards the new equilibrium, but also a shift to the left at each price level by 25 (thousand) of the demand curve in order to eliminate the excess quantity
supplied.
Thus, quantity supplied will fall by 20 000 kilos as price falls, but quantity
demanded will increase by 5000 kilos because of the falling price. So, in the
end, the equilibrium quantity has only fallen by 20 000 kilos, from 60 000 kilos
to 40 000 kilos.
Question 2
The table below shows the income tax rates that apply to different ranges of earnings
for workers in an economy.
Income (US$) Income tax rate (%)
0 – 6000 0
6001 – 20000 20
20001 – 50 000 40
50 001+ 50
• Individual A (low income) earns US$18000 per year and spends US$14000
on goods and services, of which 15% is indirect tax.
• Individual B (middle income) earns US$42000 per year and spends US$28000
on goods and services, of which 15% is indirect tax.
• Individual C (high income) earns US$100000 per year and spends US$45000
on goods and services, of which 15% is indirect tax.
(a) Distinguish between direct and indirect taxes. [2 marks]
Direct taxes are set on income and indirect taxes are set on expenditure
(b) Calculate the amount of income tax paid by individuals A, B and C as a
percentage of their income. [6 marks]
Individual A: ( 0x 6000) + ( 0.2 x 12 000) = 2400 $ (2400/18000) x 100 =13.3%
Individual B: ( 0x 6000) + ( 0.2 x 14000) + (0.4 x 22000) = 11600$ (11600/42000) x 100 =27.62%
Individual C: ( 0x 6000) + ( 0.2 x 14000) + (0.4 x 30000) + (0.5 x 50000) = 39 800$ (39 800/100 000) x 100 =39.8%
(c) With reference to the concepts of average and marginal rates of tax,
use the data from the table to explain whether this type of income tax is
progressive or regressive. [4 marks]
The average rate of a progressive income tax paid increases as the individual's income increases while regressive is vice versa. In this case as shown by the numbers and figures in table and part b, the marginal rate of tax is higher than the average, meaning this tax is progressive.
(d) Calculate the amount of indirect tax paid by individuals A, B and C as a
percentage of their income. [3 marks]
Individual A: ((14 000 x 0.15)/ 18 000) x 100 = 11.67%
Individual B: ((28 000 x 0.15)/ 42 000) x 100 = 10 %
Individual C: ((45 000 x 0.15)/ 100 000) x 100 = 6.75%
(e) Calculate the average rate of total tax (direct + indirect) paid by individuals
A, B and C on their individual incomes. [6 marks]
Individual A: 13.3% + 11.67% = 25%
Individual B: 27.62% + 10% = 37.62%
Individual C: 39.8% + 6.76% = 46.55%
(f) Explain why governments often have tax systems in which the average rate of
tax rises as income rises. [4 marks]
Governments often use progressive income tax to tackle the problem of inequitable distribution of income. They use higher income tax rates on people who earn more income to redistribute the money from the richer citizens to the poorer and therefore be closer to equal distribution and possibilities for everyone.
Sunday, 6 March 2016
Sunday, 28 February 2016
IB question structuring
3. (a) Explain what might happen to the level of inflation if a government decides to move from a budget surplus to a budget deficit. [10 marks]
Inflation happens when there's a sustained increase in the average price levels. As in macroeconomics one of governments' main objective is low and steady rate of inflation, they are often ones trying to manipulate it. Government can target inflation through spending, as government spending is part of Aggregate demand which determines inflation. AD= C+G+I+(X-M)
As government moves from budget surplus; meaning they receive more tax revenue than they spend in a year. To a budget deficit; a government spending more than it earned as a tax revenue over a year. It likely means they have increased the governmental spending in the economy, which means an increase in AD and is therefore likely to increase the rate of inflation.
Another way a government could go from a budget surplus to budget deficit, yet still cause a rise in the rate of inflation is by decreasing taxes. A decrease in taxes would mean less government revenue yet it would encourage more spending in the population, therefore increasing AD.
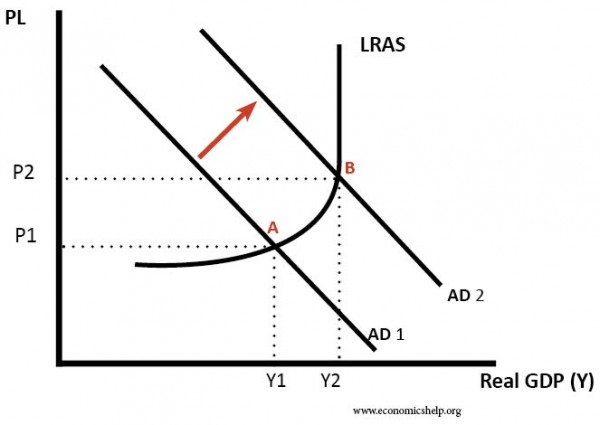
Through these expansionary fiscal policy methods, governments would increase AD, causing the AD curve to shift to the right. Resulting in a new equilibrium B, at which the average price levels have increased from P1 to P2 and the Real GDP has increased from Y1 to Y2. This would only happen if we were to assume cetris paribus for the other determinants of AD and that there has been no outwards shift in the LRAS. As there is no increase in supply in the long run, it could possibly be a demand-pull inflation as the economy isn't able to meet the demand and would be forced to increase prices. Therefore if through government spending or decrease in income tax as an example of expansionary fiscal policy, the AD shifts outwards resulting in higher average prices there has been an increase in the rate of inflation.
In real world this might not always end up in the best way as high inflation might cause more inflation as people will be looking for cheaper goods to buy and the countries own goods would not be competitive enough on the world market, therefore increasing imports and decreasing exports. This could lead to trade deficit, in return causing a further decrease in the governments budget. This situation is known as the twin deficit hypothesis. This is a situation United States has been battling for many many years already.
(b) To what extent is an increase in interest rates the most effective cure for inflation? [15 marks]
As mentioned above, inflation is often combated through governments activities such as fiscal, but also by central banks activities. Interest rates, the cost of a loan expressed as a percentage, is part of monetary policy. Monetary policy includes the Central Bank managing interest and exchange rates to control the quantity of currency in the economy.
As the central bank rises interest rates, it will lower borrowing and encourage saving instead as consumers are likely to benefit more from saving due to higher interest rates. Less borrowing and more saving means less spending in the economy, eventually meaning less consumption. As mentioned above C is a part of AD, therefore a decrease in C would mean a decrease in AD. Vice versa to the explaining in part a, when AD lowers, the APL and real GDP are likely to fall.
 As there is a shift to the left from AD1 to AD2, the APL drops from P1 to P2, but there is also a drop for real GDP from Y1 to Y2. From this graph we can also see how using interest rates would only work in the short run. In the long run the suppliers would adjust back to the more efficient level.
Yet using interest rates too vigorously and for too long to combat inflation rates may hinder economic growth. As shown in the graph the real GDP values drop together with inflation as there is less consumption. Less consumption is essentially less demand in an economy, so in the long run businesses will want to opt for the new level of demand and will decrease their production. Decreasing production in return means letting workers go, therefore increasing the level of unemployment in the economy. high levels of unemployment in return means even less consumption, furthering the drop in inflation. Eventually the drop could get too big and start to harm the economy instead. For businesses, higher interest rates also mean less investment therefore hindering businesses from evolving in terms of size and efficiency.
Additionally, higher interest rates may encourage foreign portfolio investments, therefore causing an appreciation in the currency. Higher exchange rate in return makes it harder to export and better to import, resulting in trade deficit; high imports might eventually worsen the inflation again.
Therefore we can conclude that interest rates are a good and efficient way to effectively combat high inflation quickly and for a short amount of time. Yet even then it depends whether inflation is a result of an appreciated currency or high AD. Yet if there's a need to control inflation in the long term, the most effective ways include supply side policies such as subsidies and tax breaks for producers to increase the long run supply to meet the rising demand and therefore combat rising price levels and still maintain economic growth.
Monday, 11 January 2016
Economic predictions for 2016
Estonia's real estate market
In the fourth quarter of 2015, a total of 15,110 transactions worth about 747 million euros were made. A year ago in the fourth quarter, a total of 13,830 real estate transactions were made, worth 628 million euros.
Real estate price index growth in the third quarter of 2015 compared to the third quarter of 2014 was 14.5% and 2.5% compared to the last quarter. The apartment price index grew by 9.3%, undeveloped land price index of 27.4%, and the built-up residential price index of 18.5%.
Yet the real estate prices have already been climbing rapidly for the past couple of years, especially in the capital of Estonia. Tallinn and the surrounding county, considered the "first Estonia" compared to the rest of the country "2nd Estonia" has seen even more aggressive rise in prices, therefore pushing up there rates for the whole country. As most young people come to study and live in Tallinn for the first years of their adult lives, this situation is making it hard for young people, especially for young families to buy themselves a home. At this point it is very hard to find an apartment/house in Tallinn that costs under a 100,000€ and is in a condition where you could move in today. Yet these apartments, especially the new ones being built are more and more often bought by foreigners, consequently showing the market that there are enough people to buy the apartments for the current prices, allowing brokers to ask for even higher prices in the near future.
As the average salary in Estonia is greatly lower than the average in the rest of the Europe, it is becoming more and more difficult for locals to buy real estate. More loans are being taken, yet younger people are often not able to get a loan either. Therefore I predict that in the third or 4th quarter of the year 2016, the real estate market of Estonia is about the crash. Prices are going to drop and once again the market will hit a recession, leaving unfinished buildings standing by the sides of the roads.
Subscribe to:
Posts (Atom)